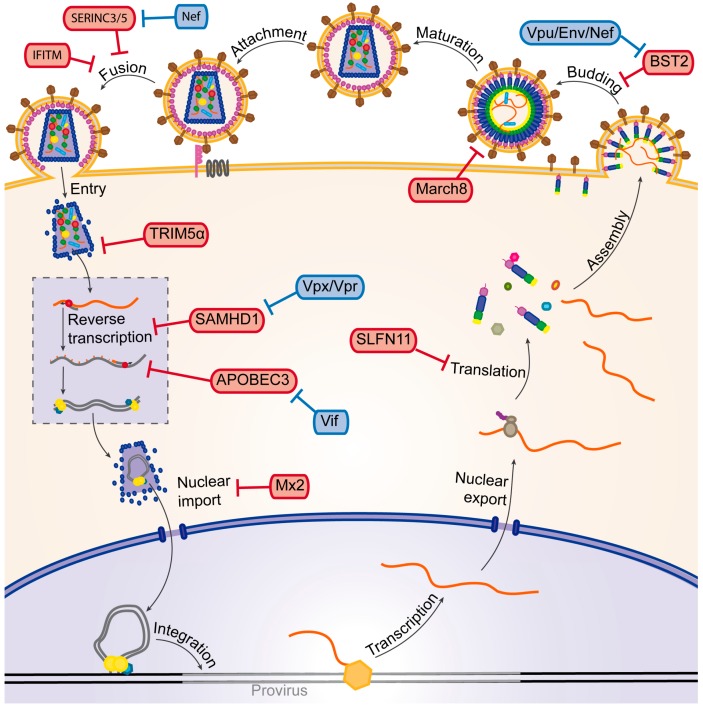
Figure 2.
Schematic representation of the HIV-1 life cycle. The main HIV-1 restriction factors and the viral auxiliary proteins that counteract these factors (represented by T bars) are highlighted in red and blue boxes, respectively. See text for a description of the different steps of the life cycle.

