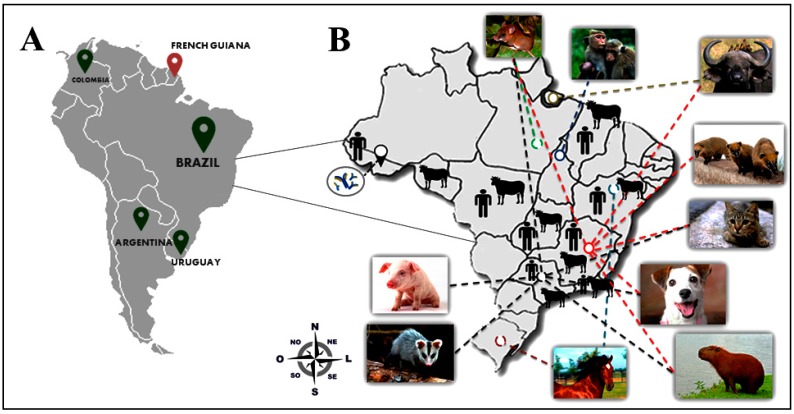
Figure 1.
Detection and distribution of vaccinia virus (VACV) in South America. (A) A map of South America is shown on the left and the green pins indicate countries where VACV has been detected in recent years. The red pin indicates the absence of VACV detection in French Guiana; (B) A map of Brazil highlighting the distribution of VACV in different regions and the detection of VACV in a broad range of hosts. The antibodies (blue) indicate serological evidence of VACV circulation in humans in rural areas of Acre state. Dashed lines in different colors represent VACV circulation in different Brazilians states, i.e. red dashed lines represent VACV circulation in Minas Gerais State, black dashed lines represent circulation in São Paulo State, and green dashed lines represent circulation in Pará State.

