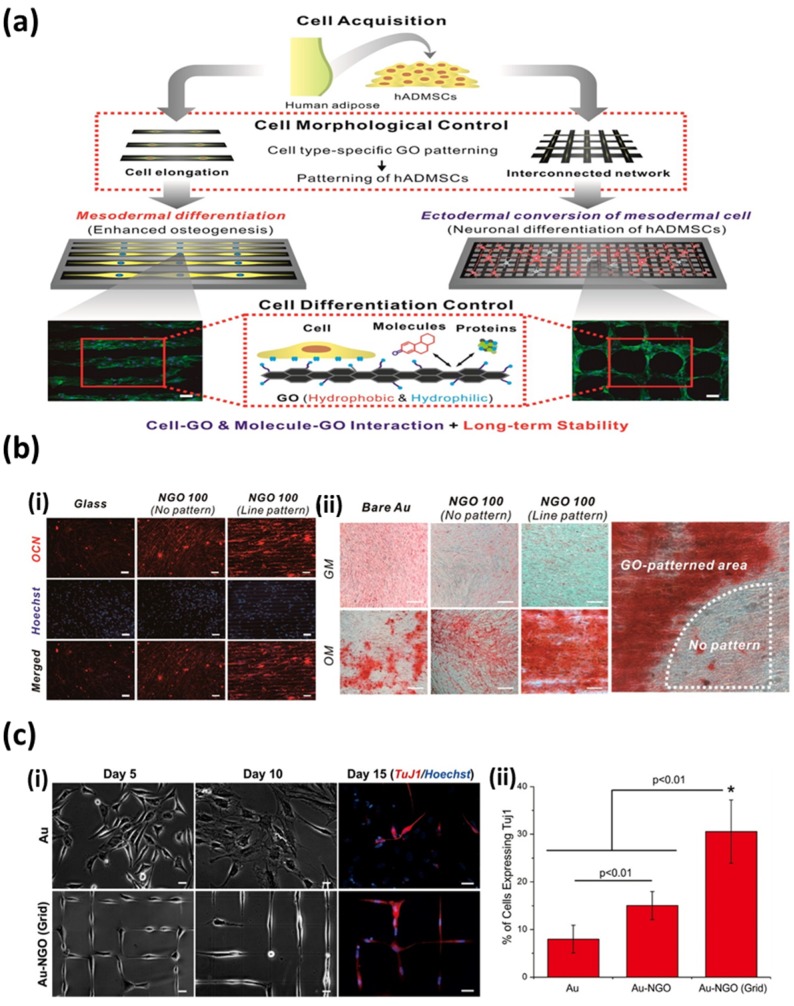
Figure 8.
(a) Schematic diagram depicting control over the differentiation of human ADMSCs using the geometries of GO-patterned arrays. (b) Enhanced osteogenic differentiation of human ADMSCs using GO line-patterned arrays. (i) Fluorescence images of human ADMSCs on GO line-patterned arrays, showing elongated and well-spread morphology of human ADMSCs. Scale bars are 50 μm. (ii) Enhanced osteogenic differentiation of human ADMSCs confirmed by Alizarin Red staining at day 21. Scale bars are 50 μm. (c) Encouraged neuronal differentiation of human ADMSCs using GO grid-patterned arrays. (i) Fluorescence images of neural induced human ADMSCs on poly-L-lysine (PLL)-coated Au and GO grid-patterned arrays. Scale bars are 20 μm. (ii) Quantitative analysis of the percentage of cell expressing the neuronal marker (TuJ1). Reproduced with permission from [76]. Copyright American Chemical Society, 2015.

