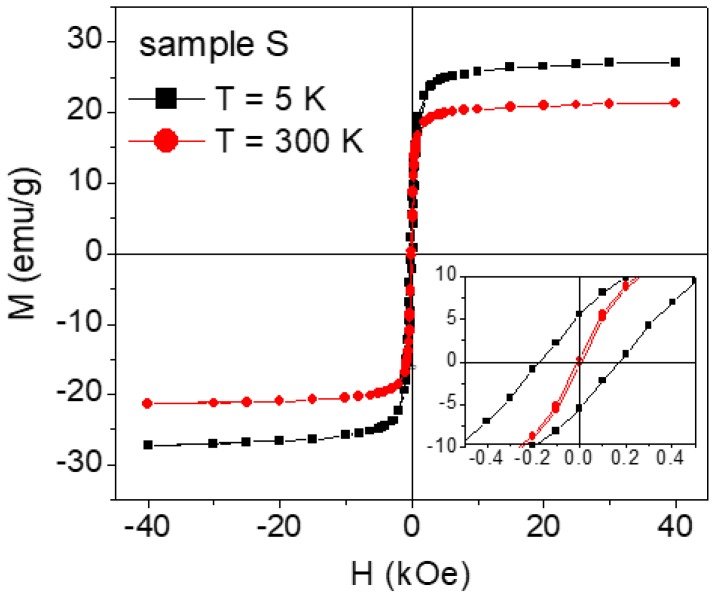
Figure 7.
Magnetic hysteresis loops recorded on the as-prepared nanoparticles (sample S) at T = 5 K (black symbols) and T = 300 K (red symbols). The specific magnetization M, relative to the whole sample mass (including 2-pyrrolidone), is reported on the y-axis. The inset is an enlarged view of the central region of the loops.

