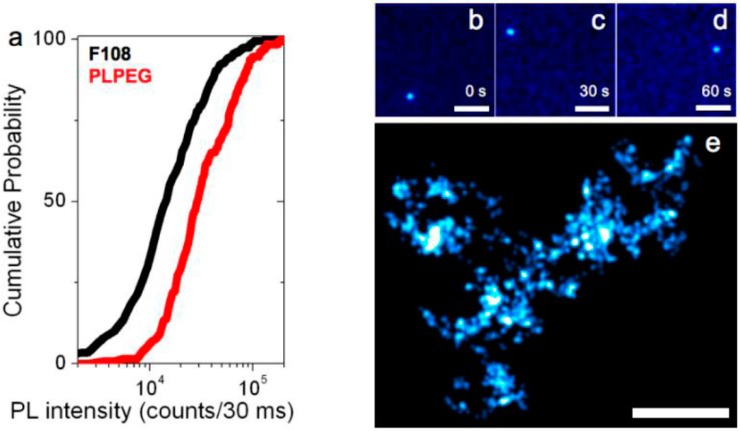
Figure 3.
Photoluminescence imaging of individual SWCNTs. (a) Cumulative distribution of the photoluminescence intensities from 162 (resp. 256) individual PLPEG- (resp. F108-) coated SWCNTs in biological media (DMEM); (b–d) Single PLPEG-SWCNT tracking in 1.5% agarose gels: three frames, separated by 30 s, of a ~1 min movie acquired at 33 Hz are displayed revealing the SWCNT trajectory within the gel; (e) Super-resolved map of the gel structure reconstructed from the collection of 2096 super-localized nanotube positions while the nanotube was diffusing. Scale bar: 5 µm.

