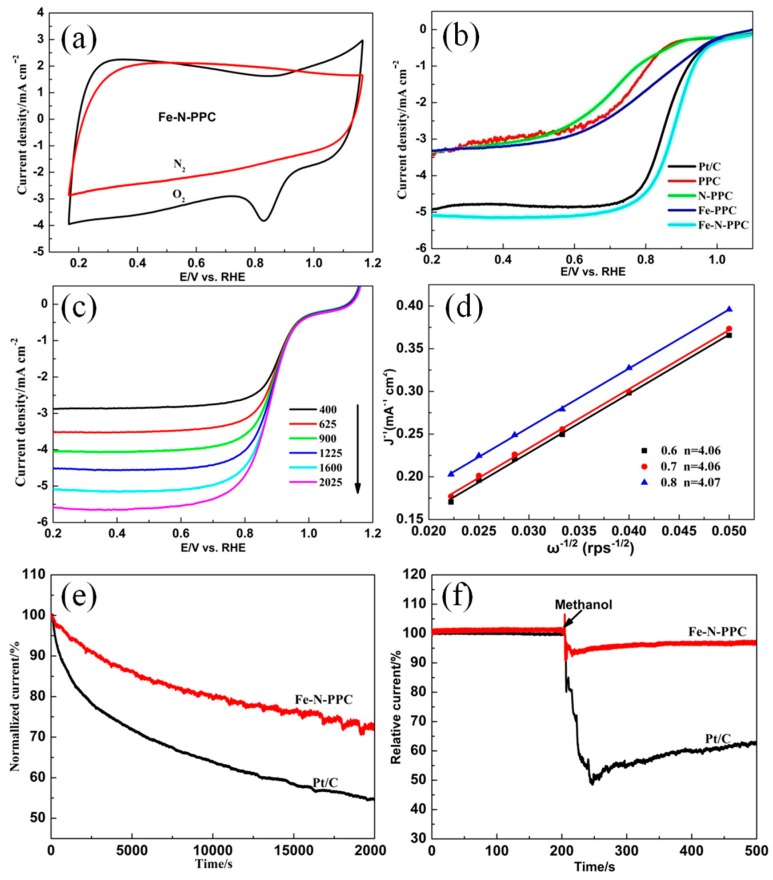
Figure 5.
(a) The cyclic voltammetry (CV) curves of Fe-N-PPC at a scan of 50 mV/s; (b) LSV curves of PPC and other samples at a scan rate of 10 mV/s and an electrode rotation rate of 1600 rpm; (c) LSV curves of Fe-N-PPC at various rotation rates and a scan rate of 10 mV/s; (d) Corresponding K–L plots at different potentials; (e) Long-term stability test of Fe-N-PPC and 20% Pt/C in a 0.1 M KOH solution; (f) Methanol (3 M) crossover resistance test.

