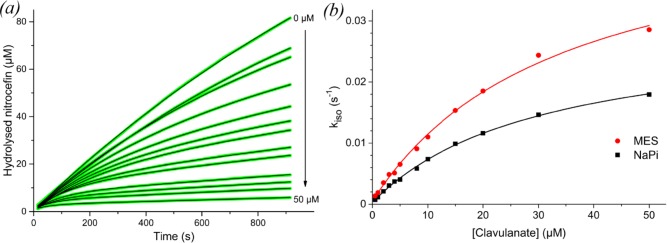
Figure 1.
(a) Inhibition curves of BlaC nitrocefin hydrolysis with increasing concentrations of clavulanic acid in 100 mM NaPi, pH 6.4. Green lines represent experimental data, black lines are fits using eq 1. (b) Plot of kiso values obtained from the fit of each inhibition curve against the respective clavulanic acid concentration, for MES (red circles) as well as NaPi (black squares) buffer. The solid lines represent the fits to eq 2.

