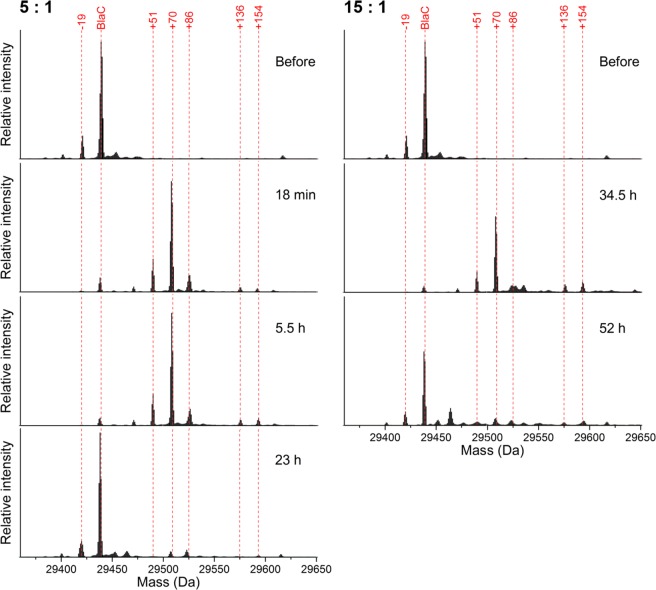
Figure 3.
Charge-deconvoluted mass spectra of BlaC before and during incubation at 100 μM BlaC with 500 (left) or 1500 (right) μM clavulanic acid in 100 mM MES, pH 6.4. Upon inhibition with clavulanic acid, the main species contain covalently bound adducts. After prolonged incubation, the enzyme returns to its free form. The lowest spectra on either side correspond to recovered enzyme activity in the samples. The MS data were obtained using a Waters Synapt mass spectrometer. Each spectrum was normalized to the total signal intensity.

