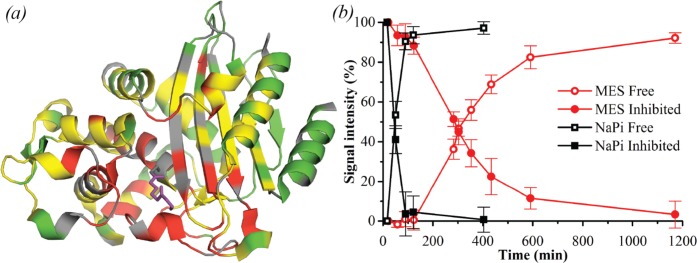
Figure 6.
Effect of clavulanic acid on BlaC as measured by NMR. (a) Crystal structure 3CG5,14 highlighting residues of which NMR resonances are affected by addition of clavulanic acid. Residues of which the amide backbone resonance experienced CSPs over 0.01 ppm and over 0.05 ppm are displayed in yellow and red, respectively, while the ones for which no data were available are displayed in gray and the remaining residues in green. The bound reacted adduct of clavulanic acid as was observed by Tremblay et al.14 is shown in purple sticks. (b) Effect of clavulanic acid on BlaC over time, in 100 mM MES (red circles) and NaPi (black squares) buffer, pH 6.4. Data points show average and standard deviation of relative signal intensities from the native (open symbols) and inhibited (filled symbols) resonances of residues Cys-69, Ala-74, Asp-131, Ala-146, and Tyr-241.

