Figure 2.
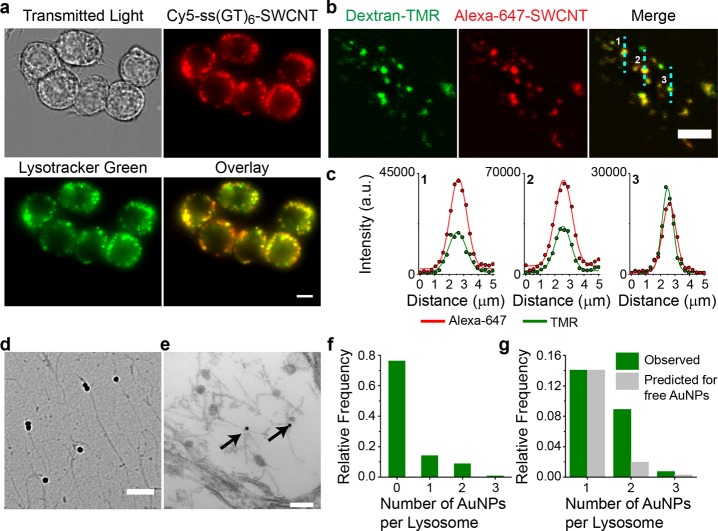
Localization of DNA–SWCNT to endolysosomal organelles. (a) Representative fluorescence microscopy images of 1 mg/L Cy5-labeled DNA–SWCNT complexes (red) and LysoTracker (green) in live cells. Scale bar = 10 μm. (b) Representative confocal images of TMR-dextran (green) and 1 mg/L Alexa-647-SWCNT (red) in U2OS-SRA cells. Lines (cyan) denote cross sections from the images extracted for further analysis in (c). Scale bar = 10 μm. (c) Intensity profiles of TMR (green) and Alexa 647 (red) fit with Gaussian functions. (d) Representative TEM images of AuNP–SWCNT complexes imaged on the TEM grid. Scale bar = 250 nm. (e) Representative TEM image of a AuNP–SWCNT complex within an endolysosomal organelle. Scale bar = 100 nm. (f) Relative frequency histogram of AuNP–SWCNT complexes per endolysosomal organelle. (g) Relative frequency histograms comparing the experimentally observed and predicted numbers of AuNPs per endolysosomal organelle if AuNPs were not attached to SWCNT complexes.

