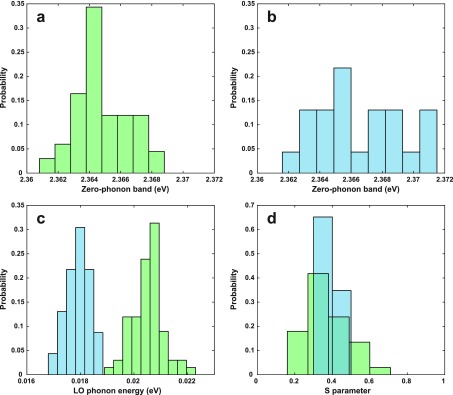
Figure 2.
Histograms of the PL parameters under nonresonant (blue) and quasi-resonant (green) excitation: (a, b) position of the highest-energy PL band; (c) LO phonon energy; (d) coupling parameter S, obtained from the ratio of the intensities of the second and first phonon replicas. The data are normalized by probability, to account for the different number of measurements in the quasi-resonant and nonresonant case.

