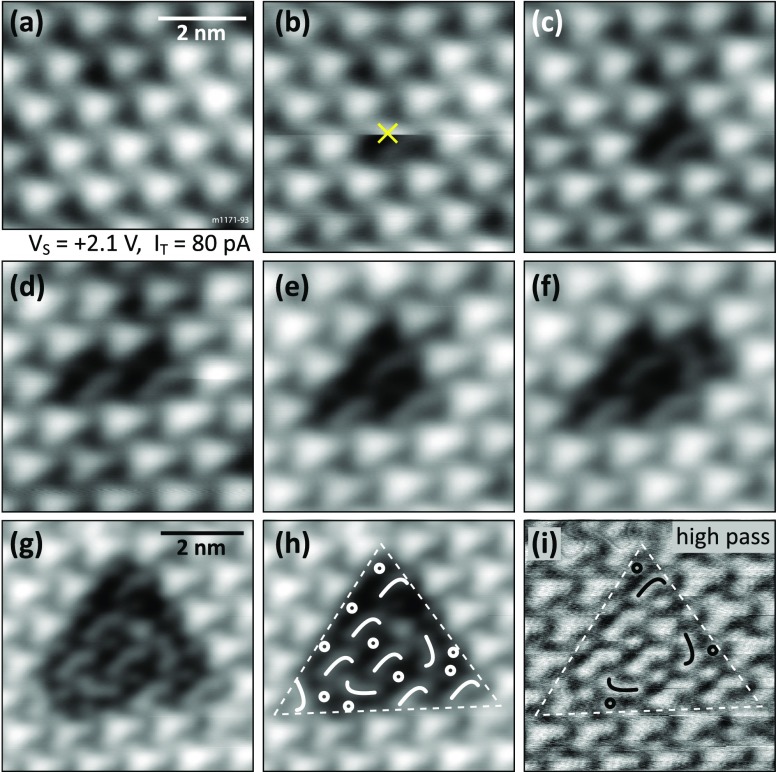
Figure 5.
Manipulation of single OH groups at T = 79 K: (a–g) Applying single voltage pulses with the STM tip while scanning (the slow scanning direction is downward). The tip is placed on top of the center of the bright triangle when the pulse (+2.8 V) is triggered. The “×” in (b) marks the position where the first pulse was applied while acquiring this image. (h) Same image as in (g), indicating the species remaining on the surface. (i) High-pass filtered version of the image before for better visibility of the surface area after removing 10 hydroxyl groups. The curved features and dots are indicated.

