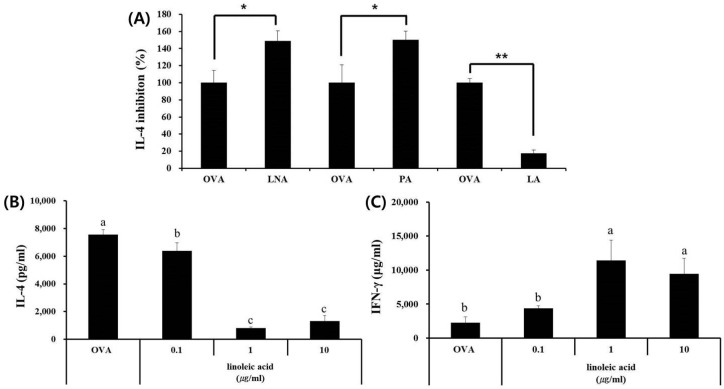
Figure 4.
Effects of linoleic acid in skullcap hexane fraction on OVA-induced Th2 immune response ex vivo. (A) LNA, PA, and LA were evaluated the capacities for IL-4 inhibition rate (%); (B) IL-4 and (C) IFN-γ were quantified by ELISA using splenocytes. Values are presented as mean ± SD (n = 4 in each group). Data were analyzed by ANOVA, followed by Duncan’s multiple-range test. (A) * p < 0.05, ** p < 0.01, significantly different from the OVA value. (B,C) Data are statistically different (p < 0.05) among those columns with different symbols. The order of value is designated as alphabetical order.

