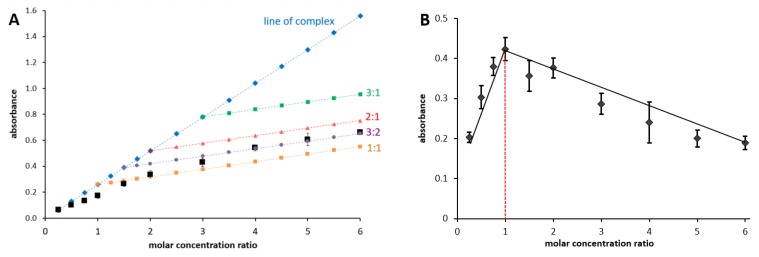
Figure 2.
Assessment of the Fe2+-isoquercitrin complex stoichiometry at pH 6.8. Complementary approach (A): the final molar concentration of ferrous ions was 15 μM and the final molar concentration of isoquercitrin was 4–90 μM. The blue line corresponds to the absorbance of the formed complex at the excess of Fe2+ ions. Other lines show possible stoichiometries. Job’s plot (B): the total molar concentration of isoquercitrin and Fe2+ ions was 100 μM. In both cases, Fe2+ ions were allowed to react with isoquercitrin for 1 min before absorbance was measured at the maximum of the absorbance of the complex (λc, 404 nm). The molar concentration ratio signifies the ratio between the concentration of isoquercitrin to that of the ferrous ions. The assessment was performed with three independent stock solutions.

