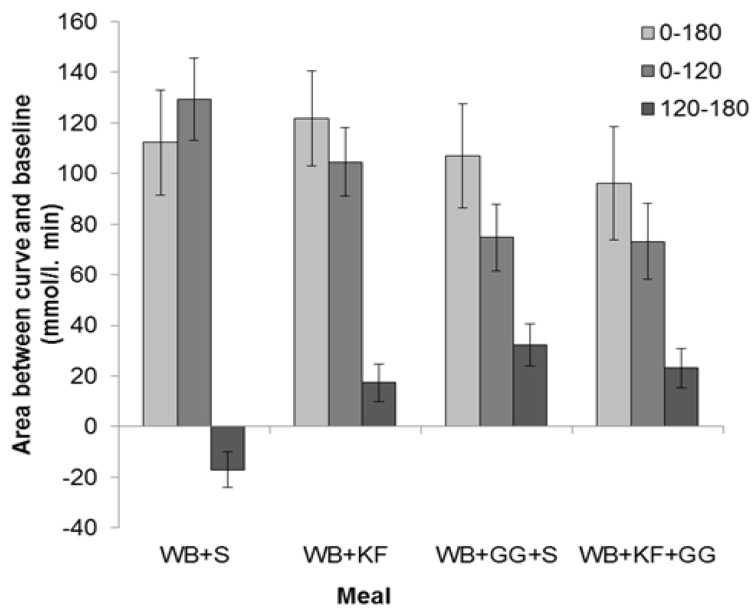
Figure 5.
Distribution of incremental areas under the blood glucose response curve in the meals consumed: Wheat bix+sugars (WB+S), WB+kiwifruit (WB+KF), WB+guar gum+sugars (WB+GG+S), and WB+KF+GG. (Means ± sem). LSDs: 0–180 min, 38.9 (p = 0.61); 0–120 min, 28.0 (p < 0.001); 120–180 min, 16.0 (p < 0.001).

