Figure 4.
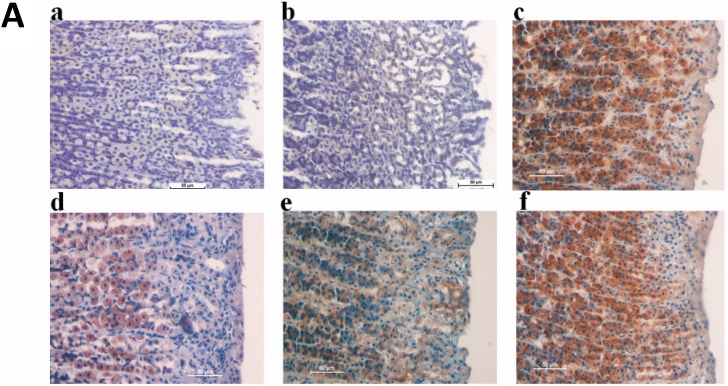
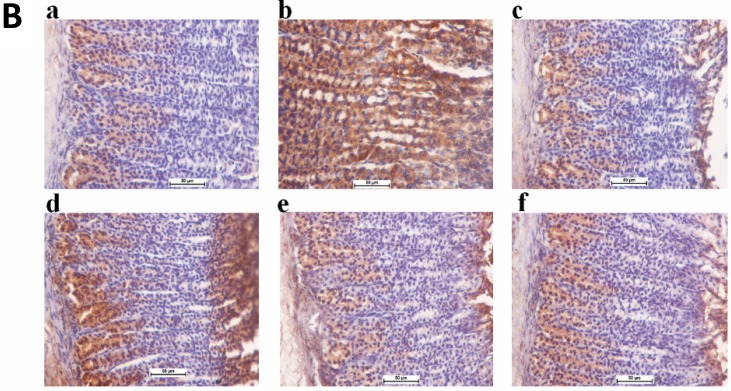
A. Expression of HSP70 proteins in the gastric tissue obtained from TIBH pre-treated groups and control groups. 4a) Normal control group; 4b) Ulcer control group; 4c) Positive control group (Omeprazole); 4d) Low dose TIBH pre-treated group; 4e) Medium dose TIBH pre-treated group; 4f) High dose TIBH pre-treated group. Positive control, TIBH high dose and medium dose pre-treated rats show the over-expression of HSP70 protein (HSP70 stain 20x). B. Expression of Bax proteins in the gastric tissue obtained from TIBH pre-treated groups and control groups. 4a) Normal control group; 4b) Ulcer control group; 4c) Positive control group (Omeprazole); 4d) Low dose TIBH pre-treated group; 4e) Medium dose TIBH pre-treated group; 4f) High dose TIBH pre-treated group. Ulcer control group animals show Bax over-expression (brown color) while in positive control, TIBH high dose and medium dose pretreated rats, Bax expression decreased (Bax stain 20x).


