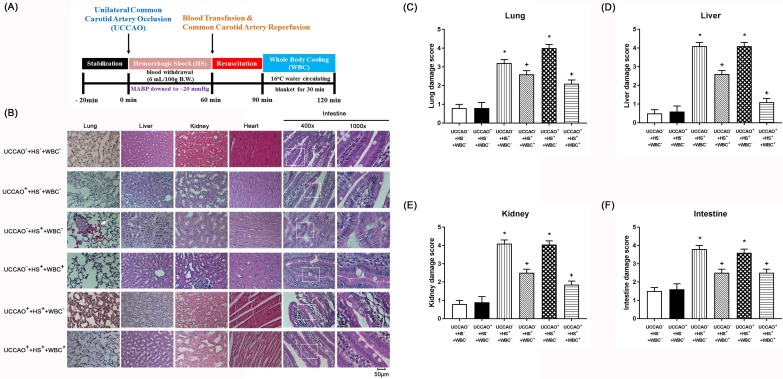
Figure 1.
(A) Experimental procedures. (B-F) Representative photomicrographs of H & E stained slices illustrating the extent of the tissue damage obtained 3 days post-hemorrhagic shock (HS) or sham intervention for the (UCCAO-+HS-+WBC-) (□), (UCCAO++HS-+WBC-) (◼), (UCCAO-+HS++WBC-) (▥),(UCCAO-+HS++WBC+) (▧),(UCCAO++HS++WBC-) (▩), and (UCCAO++HS++WBC+) (▤). Each bar represents the mean±S.E.M. (n=8 per group) of lung, liver, kidney, and intestine damage scores for different groups of rats. *P<0.05, the (UCCAO-+HS++WBC-) vs the (UCCAO-+HS-+WBC-) group or the (UCCAO++HS++WBC-) vs (UCCAO-+HS-+WBC-) group; +P<0.05 (UCCAO-+HS++WBC+) vs (UCCAO-+HS++WBC-) group or (UCCAO++HS++WBC+) vs (UCCAO-+HS++WBC-) group. 400x. Please see the explanation in the Methods section for the group abbreviations.

