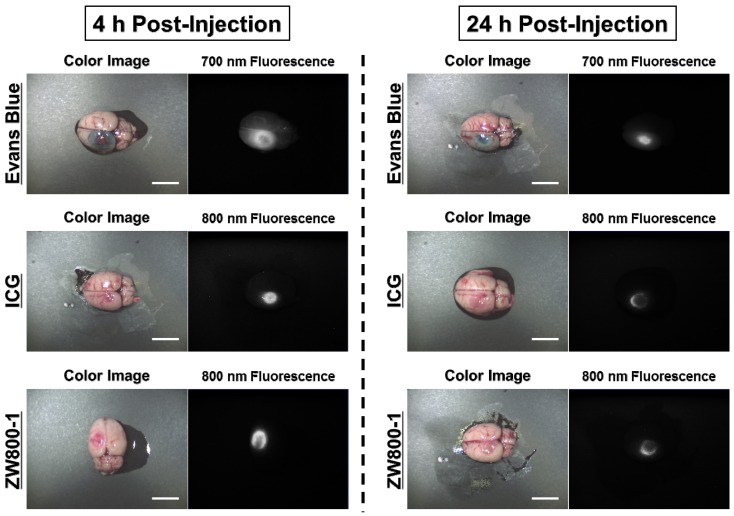
Figure 2.
In vivo NIR imaging of the infarcted brain tissue using Evans Blue, ICG and ZW800-1 in rat stroke models. 4% concentration of each dye was injected intraperitoneally into 250 g SD-rats 24 h prior to imaging and resection. Scale bars = 1 cm. Images are representative of N = 5 independent experiments. All NIR fluorescence images have identical exposure and normalizations.

