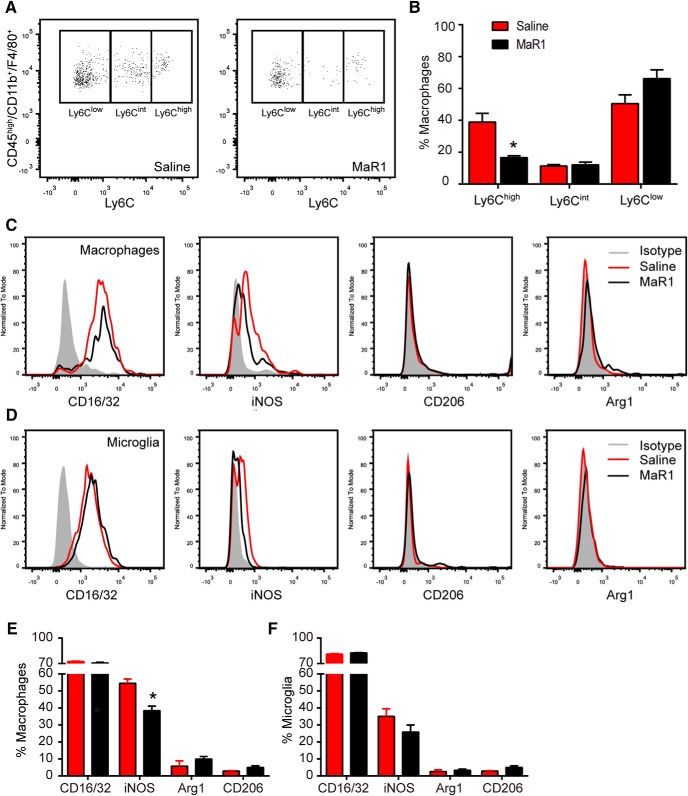
Figure 6.
MaR1 redirects macrophages toward a prorepair phenotype after SCI. A, Representative FACS analysis density plots of Ly6C macrophages in saline- and MaR1-treated mice at 7 dpi. B, Graph showing proportion of different macrophage subsets in the injured spinal cord at 7 dpi. C, D, Representative FACS histograms plots of M1 and M2 markers in injured spinal cord for macrophages (C) and microglial cells (D) at 7 dpi. E, F, Graphs showing the quantification of macrophages (E) and microglial cells (F) expressing M1 and M2 markers after SCI. *p < 0.05 versus saline. Student's t test was used to analyze significant differences between MaR1 and control mice (n = 6 per group). Data are shown as mean ± SEM.

