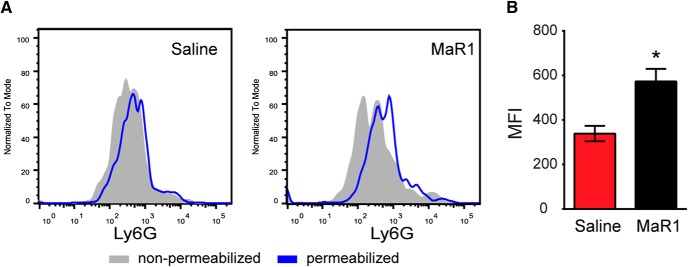
Figure 7.
MaR1 increases efferocytosis after SCI. A, Representative FACS analysis histogram plots of the specific neutrophil marker Ly6G in macrophages at 7 dpi and after saline or MaR1 treatment. B, Bar plot shows the increased in Ly6G median fluorescence intensity (MFI) in macrophages when the cell membrane is permeabilized, which is indicative of neutrophil phagocytosis. Note that MaR1 increased by ∼2-fold the engulfment of neutrophils by macrophages. *p < 0.05 versus saline. Mann–Whitney test was used to analyze significant differences (n = 4 per group). Data are shown as mean ± SEM.

