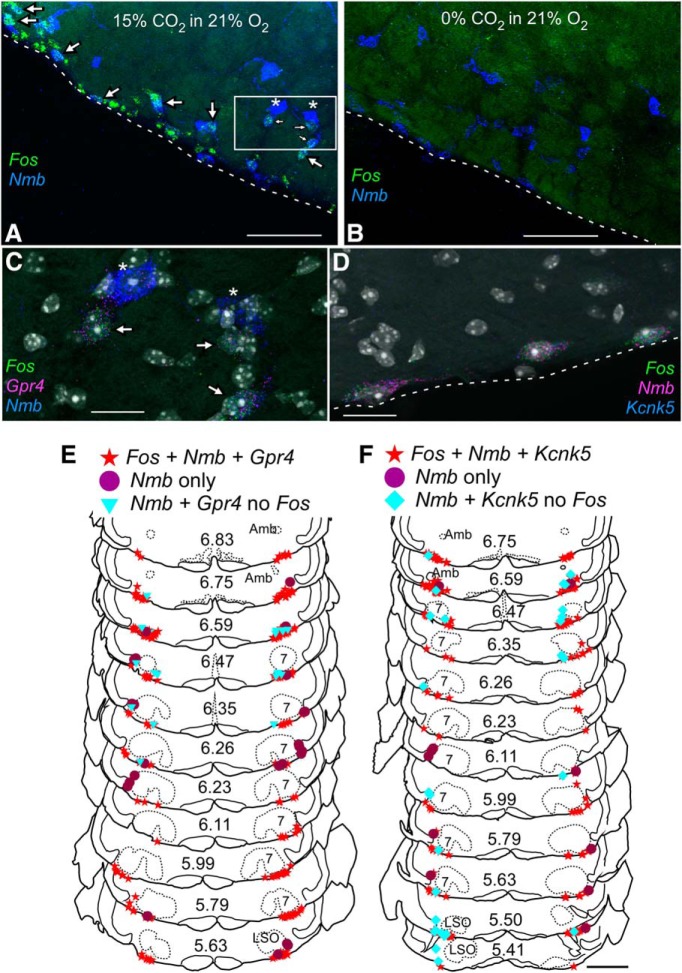
Figure 10.
RTN Nmb neurons with proton sensors Gpr4 and TASK-2 express Fos in mice exposed to hypercapnia. A, B, Photomicrographs of coronal section in caudal RTN showing transcripts for Fos (green) and Nmb (blue) in mouse exposed to 15% CO2 in 21% O2 (A) or 21% O2 (B). Many neurons express Fos under hypercapnia (A, arrows). Note that large neurons with high levels of Nmb transcripts in (A) indicated by stars do not express Fos. C, Enlargement of boxed area in A showing neurons expressing transcripts for Nmb (blue), Gpr4 (magenta), and Fos (green). Neurons indicated by stars express high levels of Nmb but low or undetectable levels of Gpr4 and do not express Fos. DAPI stain in white/gray. D, Photomicrograph of neurons expressing transcripts for Nmb (magenta), Kcnk5 (blue), and Fos (green) from mouse exposed to 15% CO2. Dashed lines in A, B, and D represent the ventral medullary surface. E, F, Drawing of transverse sections through the medulla and pons showing the distribution of Nmb neurons with Kcnk5 (E) or Gpr4 (F) and Fos after exposure to 15% CO2. The Nmb neurons that do not express Fos tend to be dorsal and lateral to the Nmb neurons that are activated by hypercapnia. Numbers in center of sections indicate mm behind bregma (Paxinos and Franklin, 2013). Abbreviations as in Figure 1. Scale bars: A, 100 μm; B, 100 μm; C, 20 μm; D, 20 μm; E, 1 mm.

