
Figure 4a.
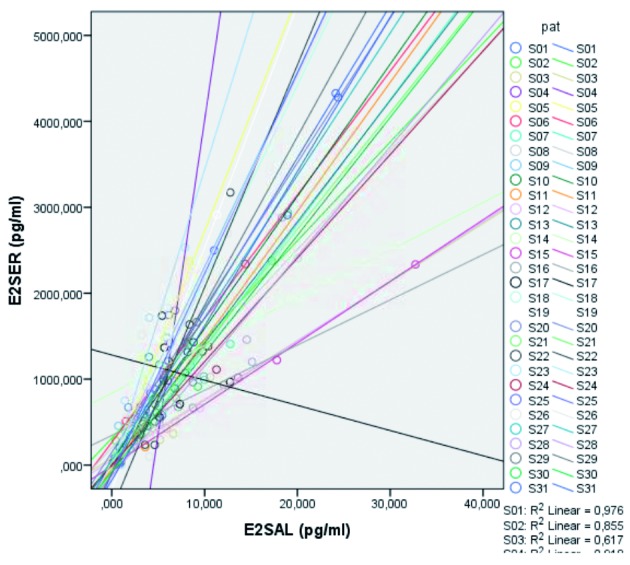
— Reduction in Level 1 variance of E2 serum (R2) for E2 serum in function of E2 saliva. The graph shows high correlation between E2 serum and E2 saliva.
Official websites use .gov
A
.gov website belongs to an official
government organization in the United States.
Secure .gov websites use HTTPS
A lock (
) or https:// means you've safely
connected to the .gov website. Share sensitive
information only on official, secure websites.
— Reduction in Level 1 variance of E2 serum (R2) for E2 serum in function of E2 saliva. The graph shows high correlation between E2 serum and E2 saliva.