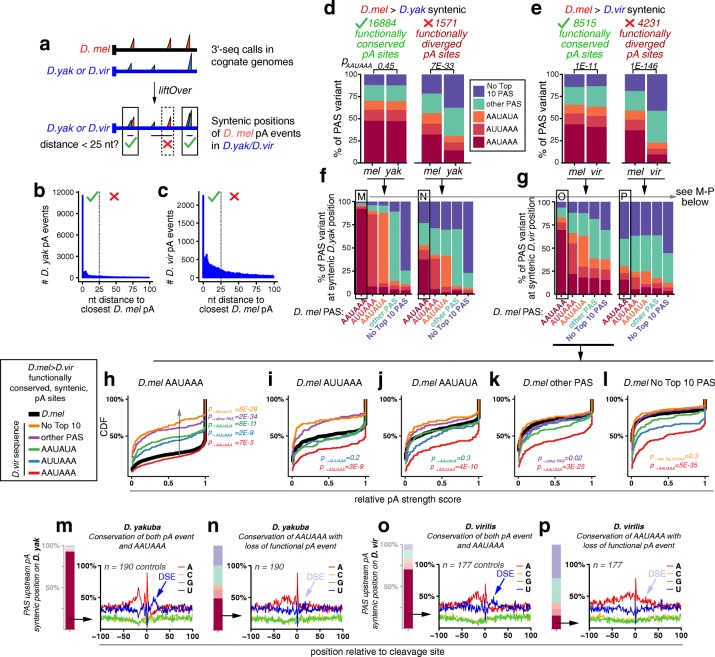
Fig. 7.
Evolutionary divergence of core poly(A) motifs has strong impact on poly(A) site usage. a The pipeline for conservation analysis. D. melanogaster pA sites were taken and syntenic locations on the genome of the species in the comparison were obtained using liftOver. D. melanogaster pA sites were considered functionally conserved if the syntenic position was within 25 bp of a 3′-seq annotated 3′ end in the compared species. b, c Numbers of D. melanogaster functional pA sites annotated to their closest functional pA sites in D. yakuba (b) or D. virilis (c). The most frequent occurrence is for precise synteny of functionally called pA sites at the nucleotide level. d Comparison of D. melanogaster and D. yakuba sites. Amongst functionally conserved sites, the distribution of PAS identities is similar in the two species. Amongst functionally divergent sites, where the syntenic position in D. yakuba is no longer a functional pA site, the PAS quality deteriorates. e Comparison of D. melanogaster and D. virilis sites. Similar trends are observed as above. f Comparison of D. melanogaster and D. yakuba sites, subdivided by PAS type. The pA site in D. melanogaster is noted below, and the bar represents the distribution of syntenic PAS sites in D. yakuba. The PAS site types are color coded as above. g Comparison of D. melanogaster and D. virilis sites, subdivided by PAS type. In f and g, the sites boxed and labeled M–P are analyzed in the corresponding panels below. h–l Relative strength of pA sites change according to change in PAS identity during evolution. These data were plotted as empirical cumulative distribution functions of the relative strength in head of conserved pA sites between D. melanogaster and D. virilis, i.e., the sites take from the left set of panels in g. Different graphs are subsets of conserved pA sites according to the identity of the original D. melanogaster PAS. The relative strength distribution of the original pAs in D. melanogaster is shown as a thick black line. Relative strength of the conserved pA sites in D. virilis are plotted according to PAS identity of conserved pAs in that species (colored lines). At functionally conserved, syntenic, pA sites, specific changes in PAS identity correlate perfectly with changes in the relative pA site usage, depending on whether the site has become stronger or weaker during evolution. The significant differences of the relative strength score between D. melanogaster PAS and converted D. virilis identities were calculated by Wilcoxon rank-sum tests. m–p Loss of a U-rich DSE is associated with loss of cleavage and polyadenylation at syntenic sites with conserved AAUAAA PAS. Nucleotide distribution around syntenic positions of D. melanogaster pA sites in either D. yakuba (m, n) or D. virilis (o, p). m Control set of functionally conserved pA sites in D. yakuba with canonical AAUAAA exhibits the expected pattern of nucleotide bias surrounding cleavage sites, including a strong downstream sequence element (DSE, blue arrow). n Nonfunctional D. yakuba sites that are syntenic to functional D. melanogaster pA sites and retain AAUAAA lack DSEs. o, p Similar comparisons of control (o) and nonfunctional D. virilis sites that are syntenic to functional D. melanogaster pA sites and retain AAUAAA (p) show loss of DSE in the latter. The barplots at the left of m–p indicate the PAS variant fractions; the AAUAAA type was used only for this analysis

