
Fig. 2.
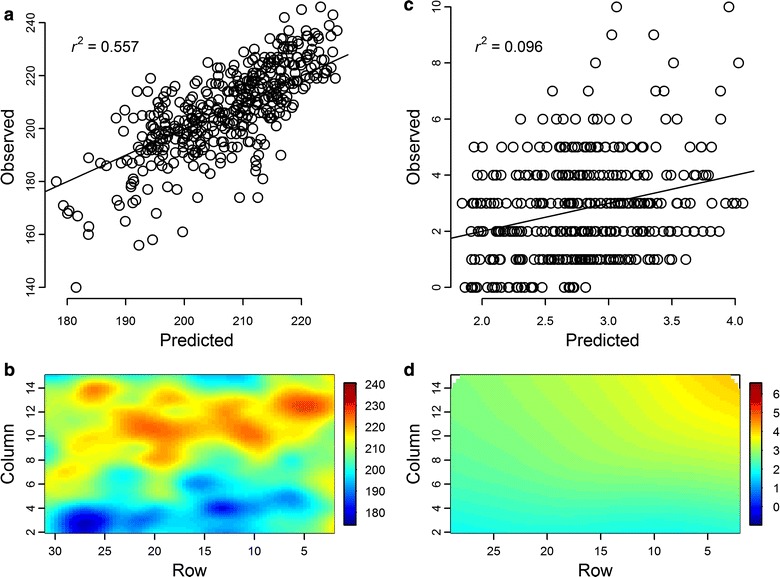
Thin-plate spline correction models. a Scatter plot of the total height values predicted by the model versus the observed values with the coefficient of determination (r 2). Also shown is the 1:1 line. b Heatmap of the trial layout with the total height predicted values by coordinate. Note that the color scale ranges from twice the standard deviation over the mean of the observed values to twice the standard deviation below the mean, to reflect the proportion of trait variance accounted for by the model. c, d Same plots for twig borer incidence