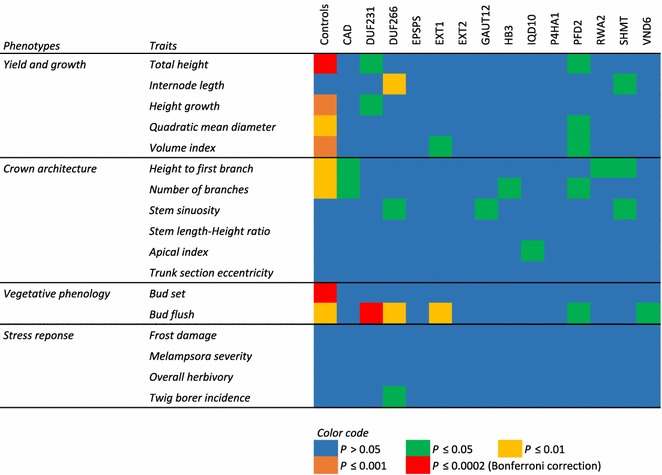
Fig. 3.

Heatmap of the level of significance of one-way ANOVAs per gene and per trait. Number of groups (k) varies as a function of the number of lines per gene: Control tests include the wild type and the seven empty-vector controls (k = 8) whereas the target gene tests include the random subsample of empty-vector trees plus the transgenic lines of each gene (from one to three; thus, k = 2–4)
