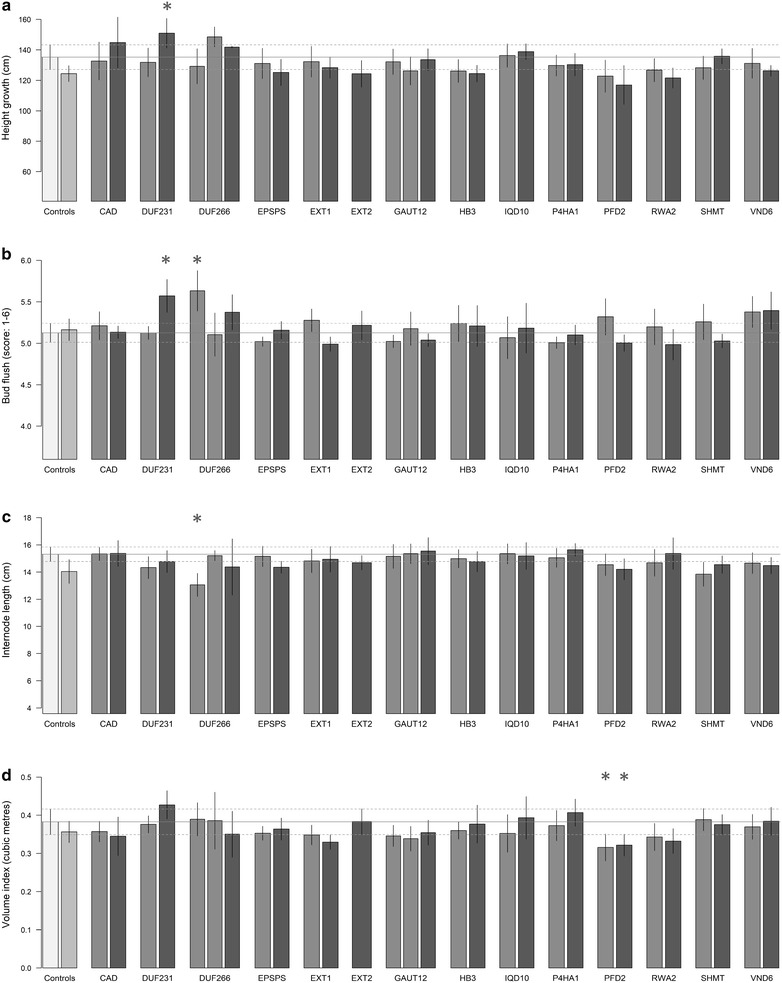
Fig. 5.

Bar plots of several measured traits after TPS correction for the random subsample of empty-vector trees (very light grey), the wild type (light grey), and the 29 trans-lines grouped by genes. Dark grey indicates Comparator lines and very dark grey indicates TOP lines. Error bars represent 95% confidence intervals. Asterisks indicate Tukey’s HSD mean difference significance (α = 0.05) between the marked transgenic line and the empty-vector control. Traits depicted are a height growth, b bud flush, c internode length, and d volume index
