
Fig. 2.
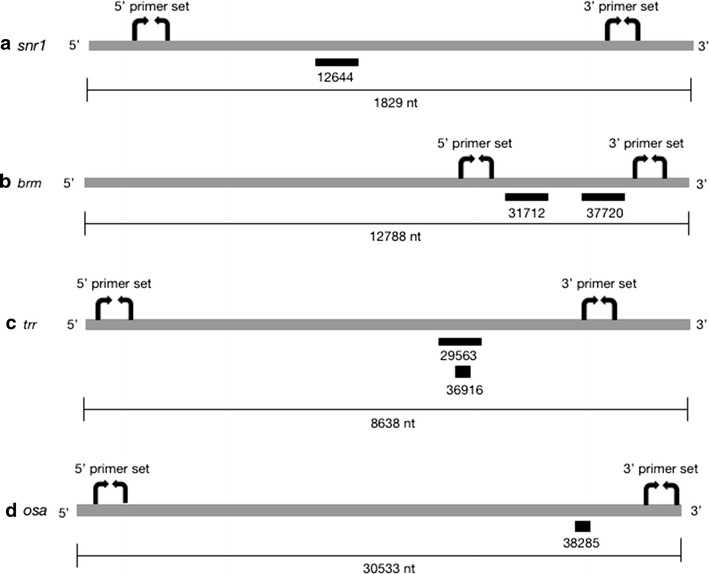
Location of RNAi cut sites and primer amplicons. Schematic representation of trr (a), brm (b), osa (c) and snr1 (d) genes, showing siRNA cut sites and location of designed primer sets. siRNAs are indicated by black bars with the UAS-RNAi stock number listed below. Primer sets are represented by curved arrows. Drawings are approximately to scale and mRNA length in nucleotides (nt) is indicated