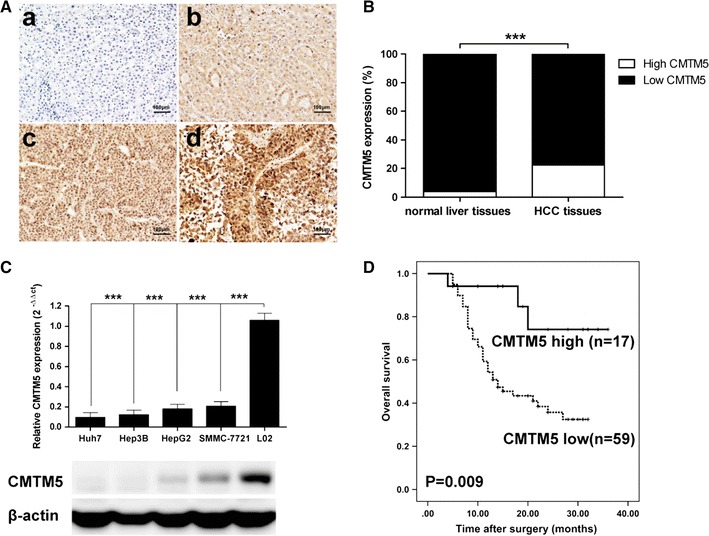
Fig. 1.

CMTM5 expression is downregulated in HCC tissues and cell lines. A Representative photos of CMTM5 staining in HCC and adjacent liver tissues (a, low, b, high, CMTM5 expression in HCC; c, low, d, high, CMTM5 expression in normal liver tissues; ×400). B The ratio of high CMTM5 expression between HCC tissues and normal live tissues, ***P < 0.001, high CMTM5 expression of HCC tissues vs. high CMTM5 expression of normal live tissues (χ2 test). C qRT-PCR and western blotting analysis of CMTM5 expression in HCC cell lines Huh7, Hep3B, HepG2, SMMC-7721 and in normal liver cell line L02. Data are shown as mean ± SD from three independent experiments, ***P < 0.001, compared with L02 group (One-Way ANOVA with Dunnett’s test). D Kaplan–Meier survival curves for overall survival according to CMTM5 expression in tumor tissues from 76 HCC patients. The P value was calculated using the log-rank test
