Fig. 2.

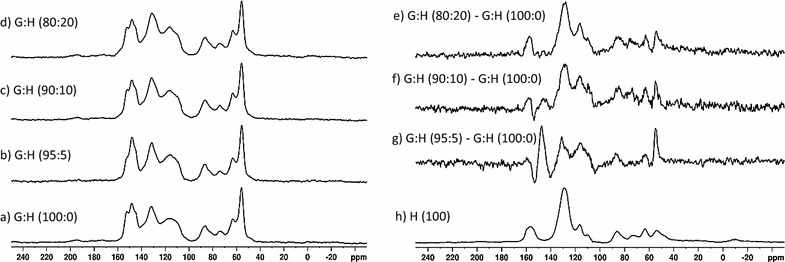
Solid-state NMR spectra: (a) G:H (100:0), (b) G:H (95:5), (c) G:H (90:10), (d) G:H (80:20). Subtraction spectra: (e) G:H (80:20)–G:H (100:0), (f) G:H (90:10)–G:H (100:0), (g) G:H (95:5)–G:H (100:0), and (h) H polymer spectrum

Solid-state NMR spectra: (a) G:H (100:0), (b) G:H (95:5), (c) G:H (90:10), (d) G:H (80:20). Subtraction spectra: (e) G:H (80:20)–G:H (100:0), (f) G:H (90:10)–G:H (100:0), (g) G:H (95:5)–G:H (100:0), and (h) H polymer spectrum