Fig. 5.

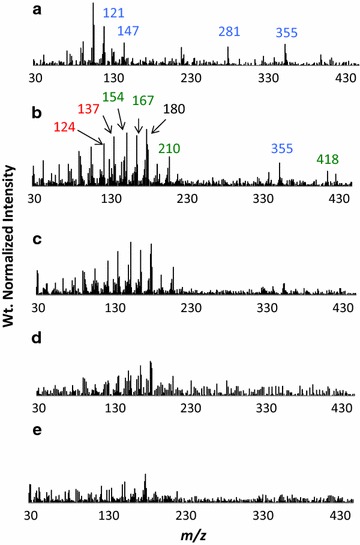
Py–MBMS spectra of lignin dehydrogenation polymers: a H, b S:G:H (40:40:20), c S:G:H (45:45:10), d S:G:H (47.5:47.5:5), e S:G:H (50:50:0). Blue corresponds to H-based ion fragments, red corresponds to G, and green corresponds to S-based ions

Py–MBMS spectra of lignin dehydrogenation polymers: a H, b S:G:H (40:40:20), c S:G:H (45:45:10), d S:G:H (47.5:47.5:5), e S:G:H (50:50:0). Blue corresponds to H-based ion fragments, red corresponds to G, and green corresponds to S-based ions