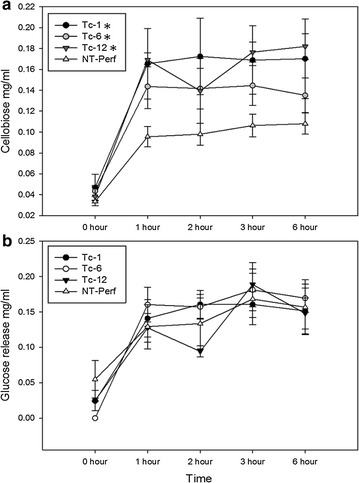
Fig. 5.

Auto-hydrolysis of TcEG1 switchgrass and non-transgenic switchgrass incubated in alkaline buffer (pH 12.0) at 50 °C. a Cellobiose released mg/mL from transgenic TcEG1 and non-transgenic (NT-Perf) lines over time. b Glucose released mg/mL from transgenic TcEG1 and non-transgenic (NT-Perf) lines over time. Bars represent mean values of three biological replicates ± standard error. Asterisk denotes statistical significant difference of released substrate over time at for event Tc-1 and Tc-12 p < 0.001 and Tc-6 p = 0.004 using Holm–Sidak method for pairwise comparison for one-way ANOVA with repeated measures
