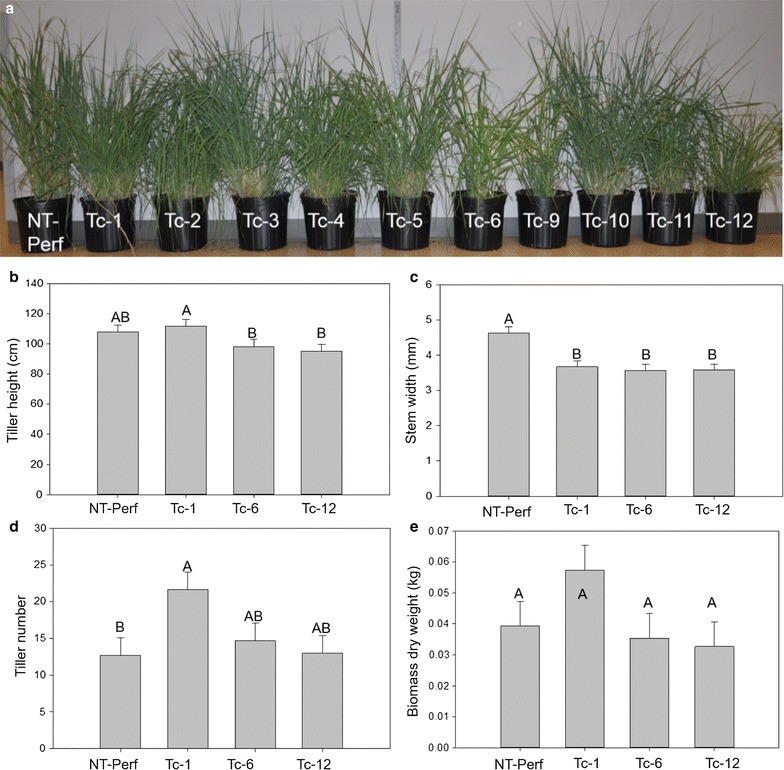
Fig. 9.

Plant morphology analysis of transgenic TcEG1 and non-transgenic switchgrass plants. a Representative transgenic TcEG1 and non-transgenic (NT-Perf) lines. Tiller height (b), stem width taken at 10 cm height above potting mixture (c), tiller number (d), and biomass dry weight (e) of transgenic TcEG1 and non-transgenic (NT-Perf) plants. Bars represent mean values of three replicates ± standard error. Bars represented by different letters are significantly different as calculated by LSD (p ≤ 0.05)
