Fig. 1.

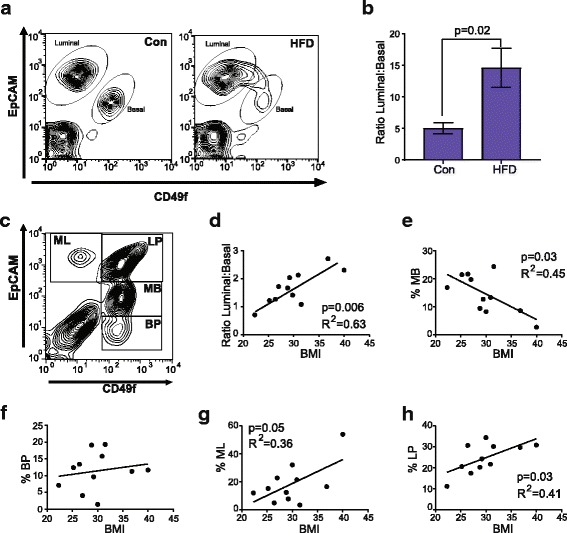
Obesity enhances luminal and decreases basal/myoepithelial cell populations. Mammary epithelial cells isolated from control (Con) and obese (high-fat diet (HFD)) C57Bl/6 mice were stained with EpCAM and CD49f and quantified using flow cytometry (a, b). a Representative contour plots depicting gates for luminal cells (EpCAMhiCD49flo) and basal cells (EpCAMloCD49fhi). The percentage of luminal and basal cells were quantified from total mammary-lineage-positive cells in three experiments (n = 9 mice/group). b Results were determined as a ratio of luminal to basal cells from obese mice compared with control mice and represented as mean ± s.d. Human breast epithelial cells were isolated from reduction mammoplasty samples, stained with EpCAM and CD49f, and quantified using flow cytometry (n = 11 patient samples). c Representative contour plot depicting gates for mature luminal (ML, EpCAMhiCD49f-), luminal progenitor (LP, EpCAMhiCD49f+), mature basal (MB, EpCAMloCD49f+), and basal progenitor cells (BP, EpCAM-CD49f+). d Correlation scatter plot with best fit line representing the ratio of the percentage of luminal to basal/myoepithelial cells. The percentage of positive cells was the number of positive cells in the gate compared to the total number of mammary-lineage-positive cells. Correlation scatter plot with best fit line representing the percentage of MB (e), BP (f), ML (g), and LP (h) against body mass index (BMI)
