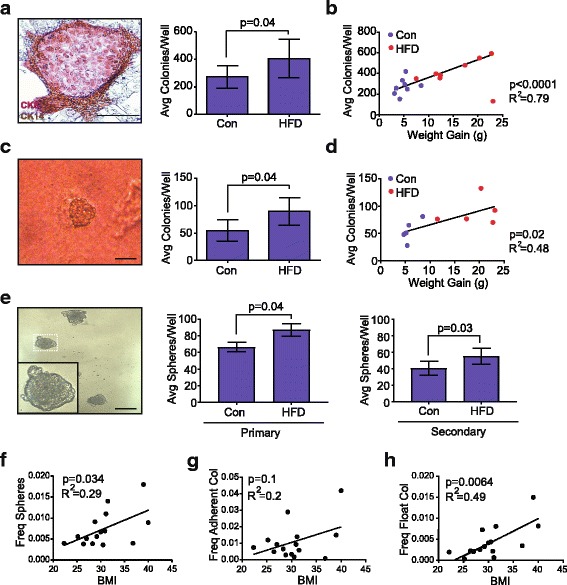
Fig. 4.

Obesity enhances mammary epithelial cell progenitor activity. a Mammary epithelial cell colony stained for cytokeratin (CK)8 (purple) and CK14 (brown) grown on an NIH 3T3 cell feeder layer. Colonies were quantified from n = 8 mice/group in duplicate. b Correlation scatterplot with best fit line representing the average (Avg) number of mammary epithelial progenitor colonies per well with respect to mouse weight gain (n = 16 mice). c Mammary epithelial cell round colony formation on collagen gel. Colonies were quantified from five mice per group, in duplicate. d Correlation scatterplot with best fit line depicting the average number of mammary epithelial round colonies on collagen gels with mouse weight gain (n = 10 mice). e Mammosphere formation in suspension on ultra-low adherence plates. Primary and secondary generation mammospheres were quantified from eight mice per group in triplicate. f Correlation scatterplot with best fit line representing frequency of mammosphere formation from breast epithelial cells isolated from reduction mammoplasty tissue with respect to body mass index (BMI) quantified from 15 patient samples in triplicate. g Correlation scatterplot with best fit line representing average adherent colony formation from 15 patient samples in triplicate with respect to BMI. h Correlation scatterplot with best fit line representing average floating colony formation from 15 patient samples in triplicate with respect to BMI. Bars represent mean ± s.d. Magnification bar = 100 μm. Freq, frequency; HFD, high-fat diet; Con, Control diet
