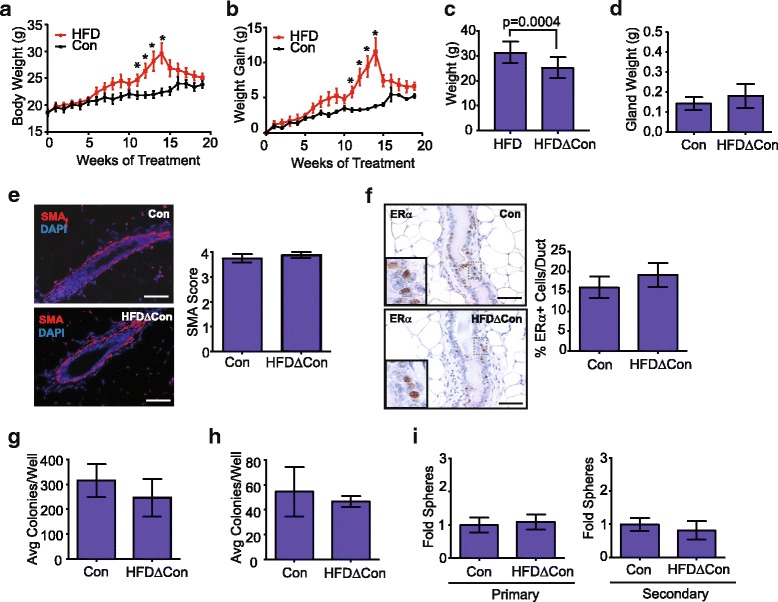
Fig. 6.

Weight loss normalizes epithelial cell populations and progenitor activity. Body weight changes (a) and weight gain (b) in 8-week-old C57BL/6 female mice fed a high-fat diet (HFD) for 15 weeks and then changed to the control diet (HFDΔCon; n = 5 mice) for 5 weeks or were fed the control diet (Con) for 20 weeks. (n = 5 mice; mean ± s.e.m.). Significance was determined using two way analysis of variance (*p < 0.05). c After 20 weeks, weight loss was calculated based on the change from a mouse’s maximal weight when consuming the HFD compared to the final weight following the diet change (n = 5 mice; paired t test). d Inguinal mammary gland weight after 20 weeks on respective diets (n = 5 mice/group). e Mammary glands were stained for smooth muscle actin (SMA, red) and 4′6-diamidine-2′-phenylidole dihydrochloride (DAPI) (blue) using immunofluorescence and five images were scored per mouse (n = 5 mice/group). f Mammary glands were immunohistochemically stained for estrogen receptor (ER)α, and the percentage of ERα+ mammary epithelial cells/duct were calculated from the Con or HFDΔCon mice (n = 5 mice/group). Mammary epithelial cells from glands from the HFDΔCon or Con mice were plated in limiting dilution on an NIH 3T3 cell feeder layer on adherent plates (g), collagen gels (h) and as mammospheres on ultra-low attachment plates (i). Adherent colonies and collagen gels were quantified in duplicate, and primary and secondary generation mammospheres were quantified in triplicate (n = 5 mice/group). Bars represent mean ± s.d. Magnification bar = 100 μm. Avg, Average
