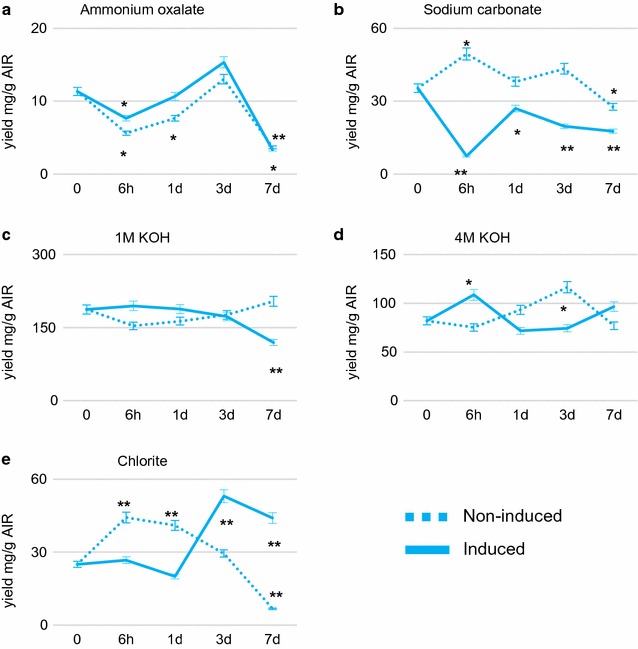
Fig. 3.

Amounts of polysaccharide sequentially extracted from cell wall residues of non-induced and BL-induced cultures using increasingly harsh solvents at the times shown. a–e indicate total carbohydrate yield in the ammonium oxalate, sodium carbonate 1 M KOH, 4 M KOH, and chlorite fractions, respectively. Non-induced and induced samples are present as dash line and solid line, respectively. All data are mean ± SE (n = 3). The significant differences from the 0-h control were determined by the Student’s t test and are represented by a single asterisk (p < 0.05) or double asterisk (p < 0.01). The significant differences by the Student’s t test between induced and non-induced samples at each time point are provided in Additional file 11: Table S8
