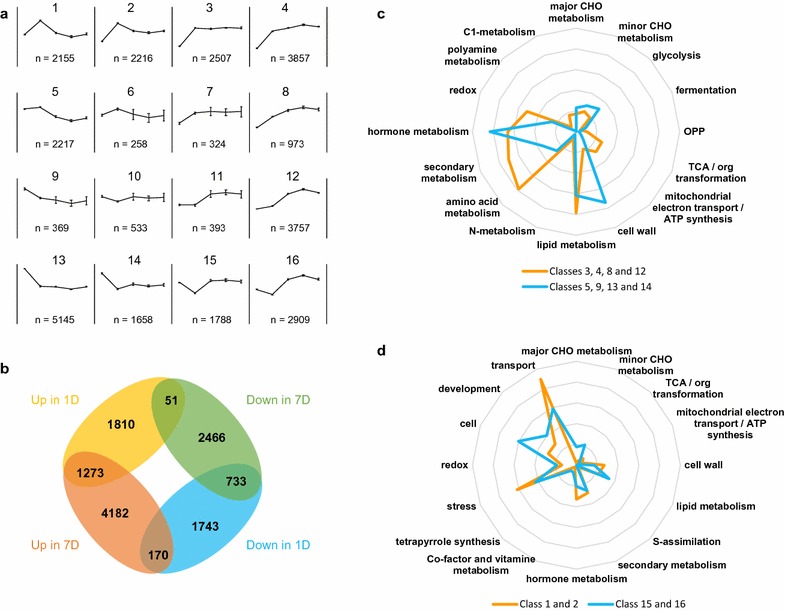
Fig. 6.

Cluster analysis of gene expression in BL-induced cultures and analysis of differentially expressed genes. a Cluster analysis of genes with at least twofold change in expression in induced cells using SOM method (4 × 4 matrix). b Numbers of differentially expressed genes between induced and non-induced cells on 1 and 7 days. c and d show relative numbers of gene functional groups in selected expression clusters
