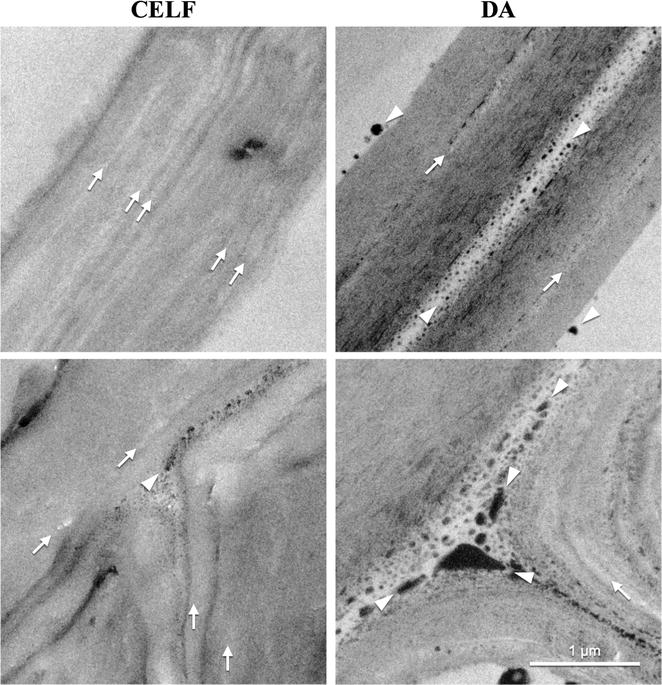
Fig. 5.

TEM of solids produced by CELF (left) and DA (right) of corn stover. Micrographs of fiber tissue show two adjacent cell walls (top) and intersection of three cell walls (cell wall corners) (bottom) at 1 μm scale. KMnO4 staining emphasizes lignin as dark regions. Arrows indicate regions of dislocation and fracturing and arrowheads point out coalesced lignin
