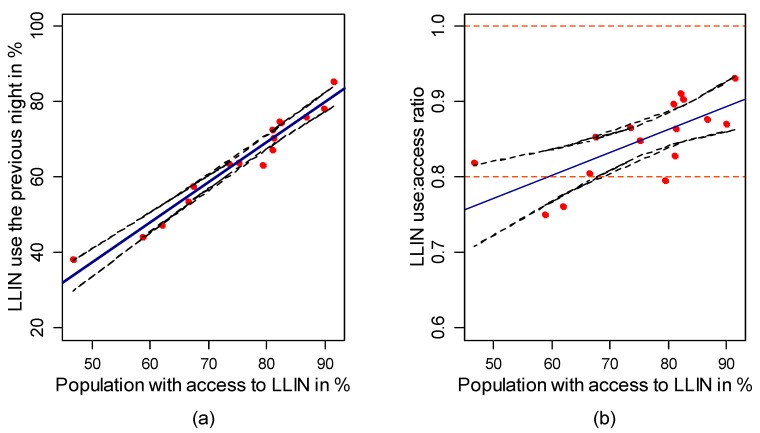
Figure 2.
(a) Relationship between population LLIN use and population access; and (b) relationship between the ratio of population LLIN use to access, and population LLIN access. The solid blue line represents the predicted values by the linear regression and the black dashed lines are the 95% confidence intervals of those values. Red points are observed values.

