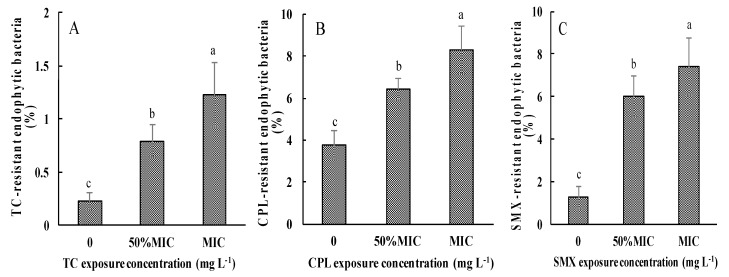
Figure 3.
Rates of AREB to TCEB in pakchoi under different dosages of antibiotic exposure. (A) TC exposure treatment; (B) CPL exposure treatment; (C) SMX exposure treatment. Values are mean ± SD (n = 3). Different letters on the top of the error bars indicate statistical difference among the treatments (p < 0.05).

