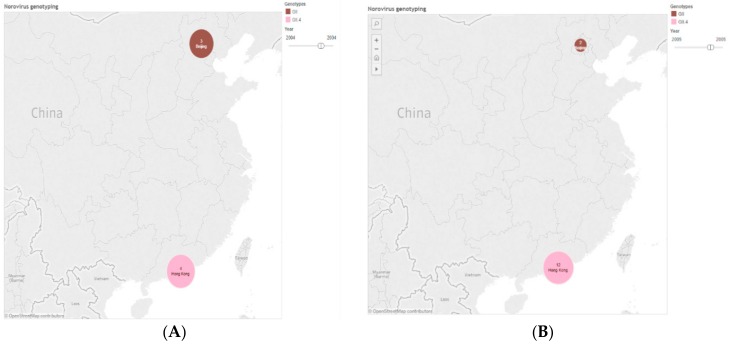
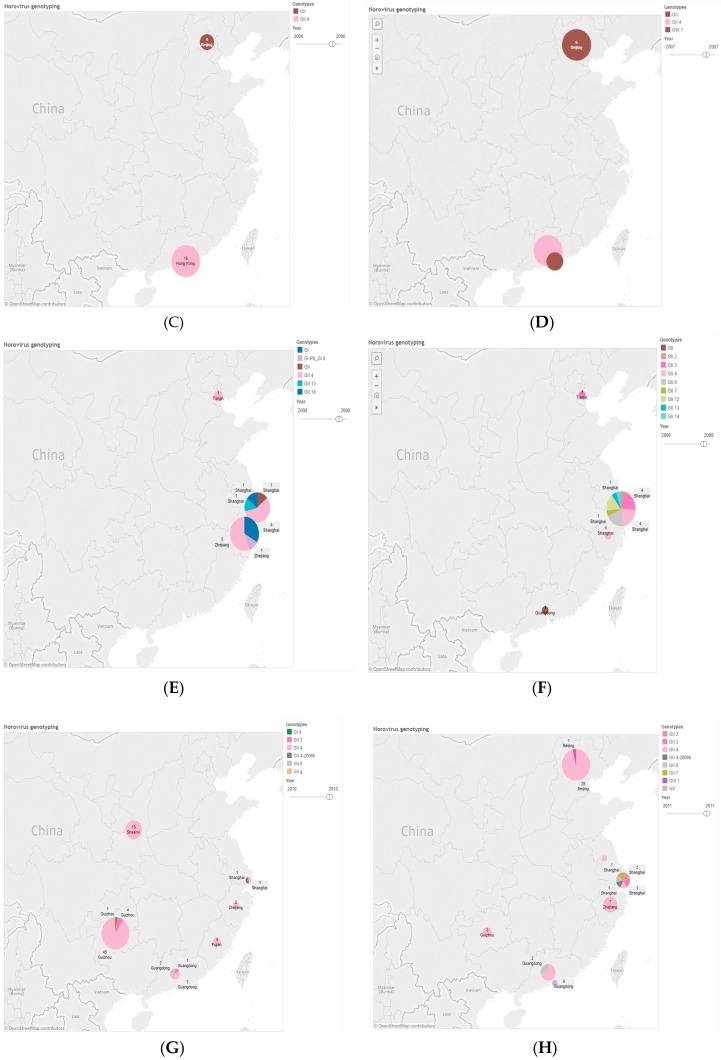
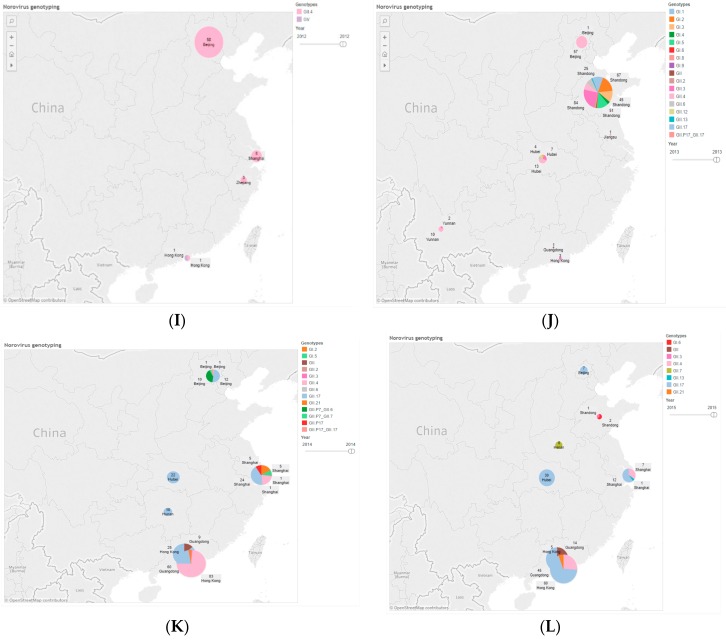
Figure 6.
Genotyping distribution in each year according to 1291 VP1 sequences of norovirus in China during 2004 to 2015. The pie in the figures were generated by the number of genotypes (n = 1291). (A) Genotyping distribution in 2004. (B) Genotyping distribution in 2005. (C) Genotyping distribution in 2006. (D) Genotyping distribution in 2007. (E) Genotyping distribution in 2008. (F) Genotyping distribution in 2009. (G) Genotyping distribution in 2010. (H) Genotyping distribution in 2011. (I) Genotyping distribution in 2012. (J) Genotyping distribution in 2013. (K) Genotyping distribution in 2014. (L) Genotyping distribution in 2015.


