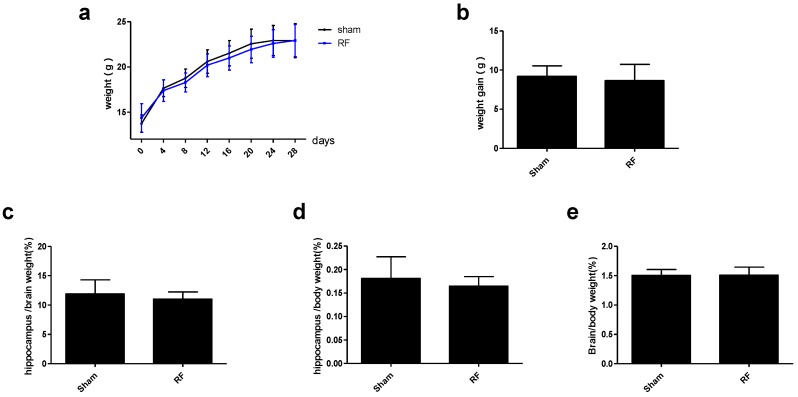
Figure 6.
Effects of RF exposure on body and organ weight. (a) growth curve (within group: df = 7, F = 657.019, P < 0.001; between groups: df = 1, F = 0.251, P = 0.619), (b) weight gain (t = 1.3, df = 68, P = 0.198), (c) the ratio of the hippocampus weight to the brain weight (t = 1.615, df = 48, P = 0.113), (d) the ratio of the hippocampus weight to the body weight (t = 1.751, df = 48, P = 0.086), (e) the ratio of the brain weight to the body weight (t = 0.145, df = 48, P = 0.886). The data are presented as mean ± SD. No significant difference was observed between the sham and RF groups (P > 0.05).

