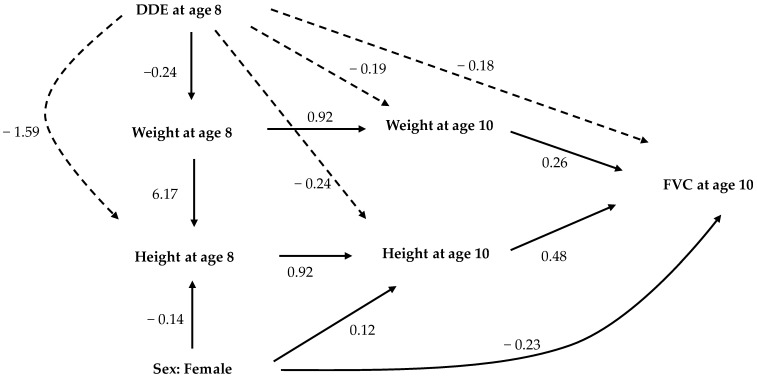
Figure 1.
Analytical path model showing statistically significant, standardized, direct, and indirect effects of DDE exposure at eight years of age, height and weight at eight and ten years of age, and FVC at age 10 years. The path coefficients represented by solid arrows are direct effects, while those represented by dashed arrows are indirect effects. Associations with non-significant total effects are not shown in this diagram. Goodness of fit criteria: χ-squared test statistic = 33.1, p-value < 0.05; AGFI = 0.898; CFI = 0.994; RMSEA = 0.048.

