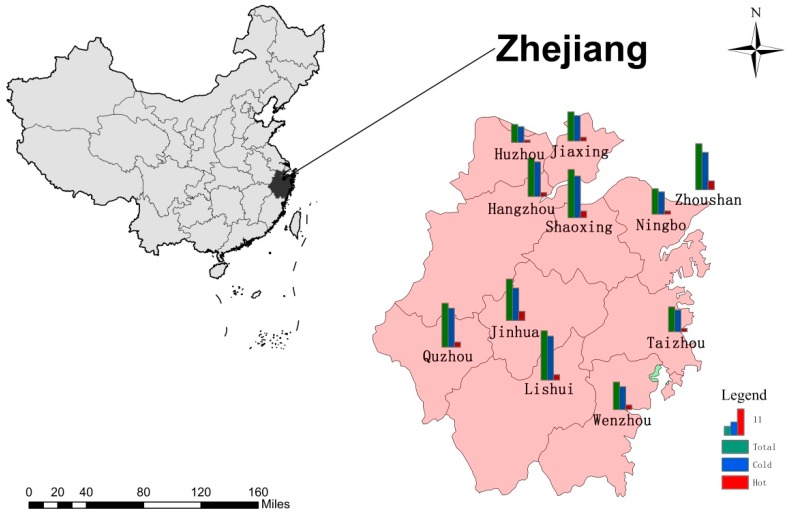
Figure 1.
The location of 11 cities in Zhejiang Province and the attributable fraction of cardiovascular disease (CVD) deaths, which were divided into cold and hot temperatures based on distributed lag non-linear model. Cold and hot effects were defined by the minimum mortality temperature. This map was formed by ArcGIS software, Version 10.1, Esri, Redlands, CA, USA.

