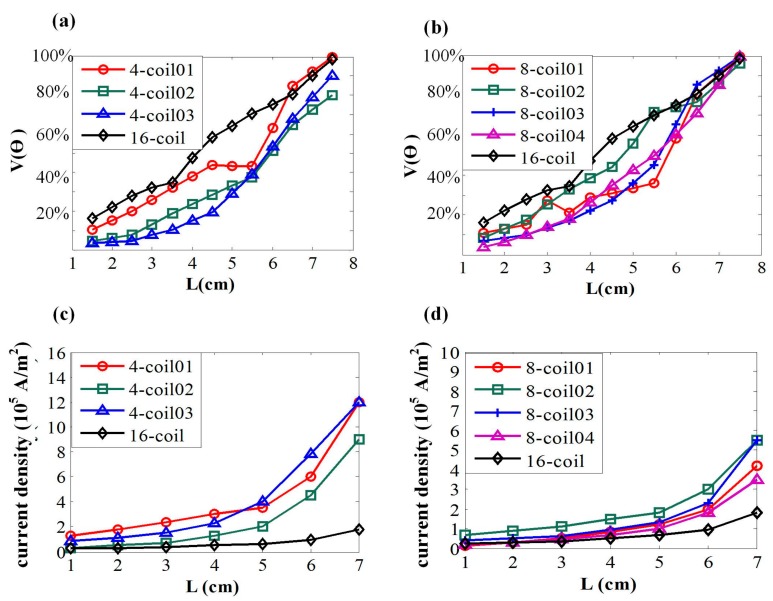
Figure 7.
(a) Overall activated proportions targeting at different stimulated depths. L indicates the length from superficial layer to the interested depth of brain tissue. (b) The relationship between targeted depths and activated proportions. (c,d) Variation tendency of current density with the increase of targeted depth. The input energy is represented by current density of each individual coil.

