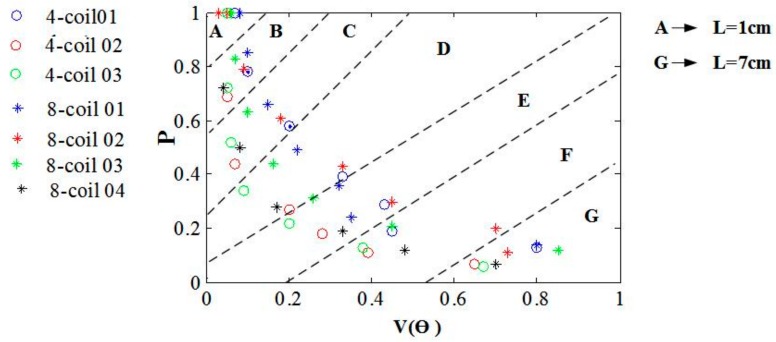
Figure 9.
Strengths of the induced EFs at different depth are normalized with respect to the maximum EF amplitude estimated on the cortex. The values of proportion are represented with P. shows the activated volume of the head model. The depths of brain tissue are marked A–G, which correspond to L from 1 to 7 cm.

