Fig. 1.

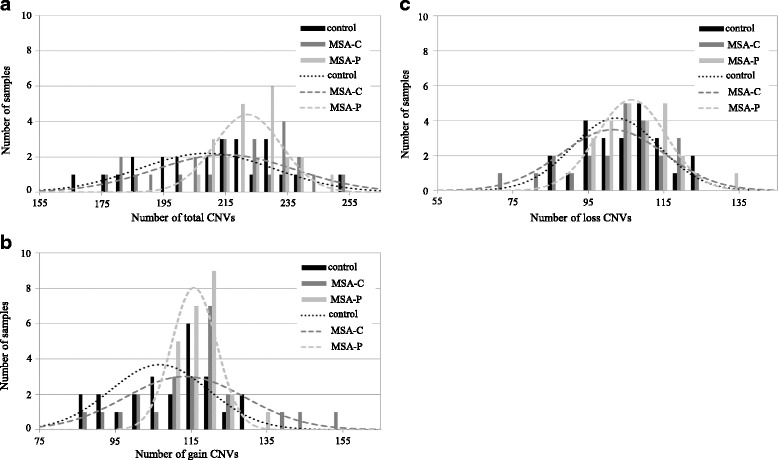
Histogram and distribution curve of each individual CNV in subjects with MSA-C or MSA-P and in controls. a Number of total CNVs (b) Number of gain CNVs (c) Number of loss CNVs

Histogram and distribution curve of each individual CNV in subjects with MSA-C or MSA-P and in controls. a Number of total CNVs (b) Number of gain CNVs (c) Number of loss CNVs