
Fig. 1.
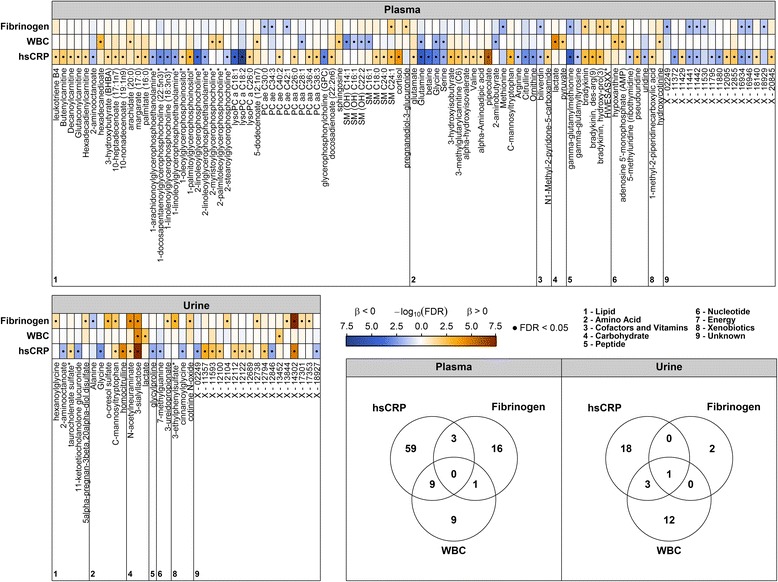
Color coded corrected P values (controlling the false discovery rate (FDR) at 0.05) from linear regression analyses for the association of high-sensitivity C-reactive protein (hsCRP), white blood cell count (WBC), or fibrinogen with plasma (upper panel) or urine metabolites (lower left panel). Significant associations (FDR < 0.05) are marked with a dot. All analyses were adjusted for age, sex, waist circumference, smoking behavior, and physical activity. Orange and blue shading indicate positive and negative associations, respectively. Corresponding beta estimates and FDR values are given in Additional file 2: Tables S1 and S2. Lower right panel: Venn diagrams depict the overlap in significantly associated metabolites to each trait in plasma and urine