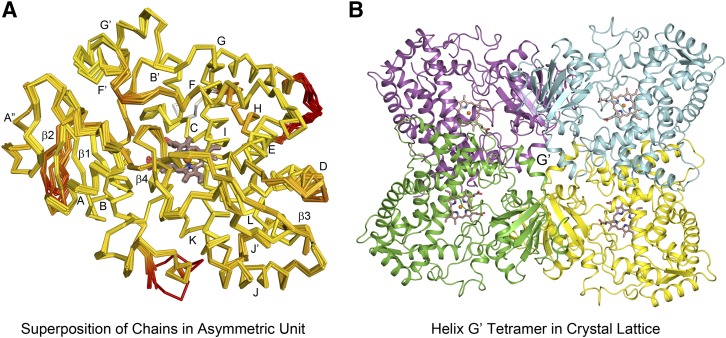
Fig. 1.
(A) Overlay of the 12 chains in the asymmetric unit computed using ProSmart (CCP4) are depicted by Cα traces for each chain. Yellow-to-red color changes indicate increased divergence for both the backbone and side-chain rotamers. Helices are indicated by letters and β-sheets by numbers. (B) One of the three tetrameric substructures of the asymmetric unit, centered on lattice interactions of G′, helices is illustrated for chains A (yellow), D (cyan), E (magenta), and I (green). The heme and Fe are depicted as sticks and spheres, respectively. The carbons of the heme are colored brown, oxygen red, nitrogen blue, and iron orange.

