Fig. 3.
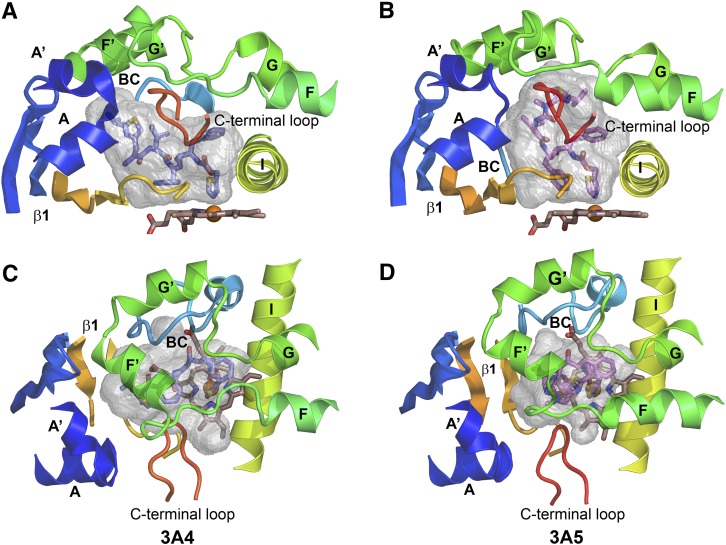
The substrate binding cavity of the 3NXU structure of the 3A4 ritonavir complex (A) is shorter and wider than that of 3A5 (B). The cartoon structures are colored from blue at the N-terminus to red at the C terminus with helices and beta sheets labeled. The A chains of each structure are depicted, and only portions of the structure that surround the cavity are shown. The carbons of ritonavir are colored slate blue in 3A4 (A and C) and violet for 3A5 (B and D). The cavities are rendered as gray semitransparent surfaces. (A and B) Views of the side of the cavities from the C-terminal loop side. (C and D) Views from the helix F through G side above the cavity. Note the longer F and shorter F′ helices for 3A5 in (D) compared with 3A4 in (C). The opening between F-F′ and G-G′ connecters is larger in 3A5. Additionally, the N-terminal region (blue) pushes upward and inward in 3A5 (B) relative to 3A4 (A). These changes are associated with the taller and narrower active site cavity of 3A5.

